I just discovered that Simple XML dashboards in Splunk can be customized with JavaScript! That’s right, the point and click dashboards can be customized in a very powerful way.
Here’s the official docs, and an official example. Now it’s time to show you what I did for my customization.
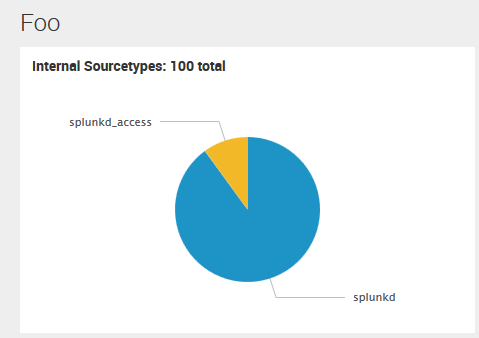
You can see here that I have a plain old pie chart – except that the title includes the total event count. Want to put this on your own charts? Keep reading!
First, we’ll modify the XML to point to a JavaScript file, and assign an HTML id to the chart.
<dashboard script="add_pie_chart_total.js"\>
  <label>Foo</label>
  <row>
    <panel>
      <chart id="pie_chart"\>
Next, create the javascript file in $SPLUNK_HOME$/etc/apps/search/appserver/static/add_pie_chart_total.js
I will attach my script that you can use or modify, and you can also refer to the official documentation I linked above for more examples.
As you make changes to the JavaScript file, you need to refresh the data/ui/views entity. Just navigate to: https://YOUR_SPLUNK_SERVER/en-US/debug/refresh?entity=data/ui/views and hit the refresh button.
And then, restart Splunk.
Finally, if you’re copying my example verbatim, add a number to the chart title. This number is a placeholder that will be replaced when the search for the pie chart completes.
That’s all for today. If you have any feedback, please get in touch!
Update: How to add a line break to text in the dashboard:
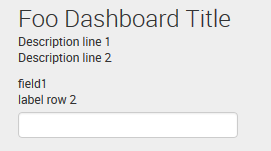
Have you ever wanted your dashboard description to span multiple lines, or perhaps a multi-line input label? Now that you know how to add JavaScript extensions, this is trivial. Just add the following lines of jQuery to the JavaScript example code attached to this post. This line of code should appear inside of the require function.
$("p.description").first().css("white-space", "pre-line"); // dashboard description
$("label").css("white-space", "pre-line"); // form labels
Now, if you put a line break anywhere in the dashboard description or a field label, it will be rendered on multiple lines when the dashboard is loaded, just like you see in the screenshot.